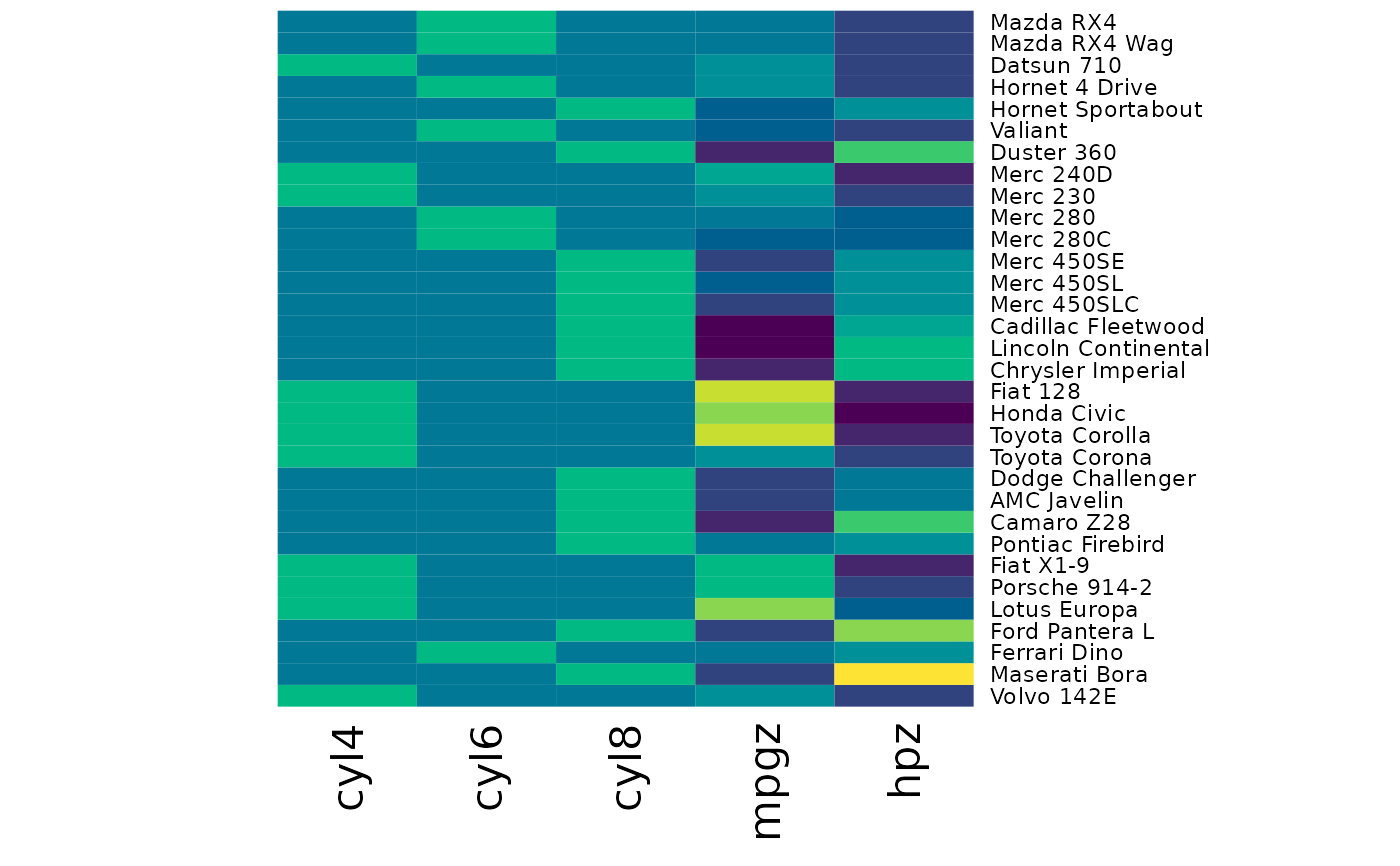
Visualise a Freesurfer qdec matrix as returned
byt the make_fs_qdec function.
Usage
# S3 method for qdec
plot(x, col = hcl.colors(12, "viridis"), ...)
Arguments
- x
a qdec object
- col
a vector of colors to be used in the heatmap.
- ...
arguments to be passed to
heatmap.scale,Rowv,Colvalready have custom values that may not be overwritten for the sake of a better visualisation.
Examples
cars <- mtcars
cars$cyl <- as.factor(cars$cyl)

qdec <- make_fs_qdec(cars, mpg ~ -1 + cyl + hp)
plot(qdec)